Week 1:Introduction
This week introduced key ideas about how technology and society shape each other🧐. I learned that instead of seeing technology as something that simply changes us, we should view it as part of a social system influenced by people, culture, and context. It made me reflect on my own use of digital tools and how design and intention affect our digital experiences.
Week 2:Create Website
I learned the basics of HTML and CSS while starting to build my own website. Coming from a journalism background with experience in interviewing, writing, and filming, I find website creation to be a completely new and exciting challenge. It was interesting to see how structure and design work together to create usability and visual appeal.
Week 3:Web sraping
Learning about web scraping helped me understand how data can be extracted and analyzed from online sources. I used "Web Scraper" to collect structured data from the website of BBC and realized how websites are built with layers of HTML elements.
Week 4:Data & Data Analysis
This week focused on how data reflects power and bias. I learned that data is never neutral — it’s shaped by who collects it and why. During the survey design activity in class, we were asked to work in groups and design a questionnaire from different perspectives. This made me realize this point even more clearly. Reflecting on my own social media use, I realized how much personal data I share unconsciously. This made me more aware of privacy, consent, and how data-driven systems influence what we see online.
Week 5:Data Visualisation
This week, I realised how challenging it can be to generate and visualise a dataset. One difficulty was deciding which variables were meaningful and how different chart types might shape the interpretation of the data. I wanted to see patterns more clearly, but sometimes the visualisations felt either too simple or too noisy, which made me aware of how design choices influence the “story” a dataset tells. If I had more time, I would experiment with larger datasets and more complex tools like Tableau to compare how different systems frame the same information.
The workshop also made me reflect on the relationship between data and power. Visualisations are not neutral — decisions about what to collect, how to categorise, and how to display information can amplify particular perspectives while hiding others. This reminded me to think critically not only about the data itself but also about the intentions and audiences behind every visualisation.
Week 6:Identity, Algorithmic Identity, and Data
This week’s workshop made me reconsider how much of my identity is constructed through data traces rather than intentional self-presentation. Exploring my platform’s stored data showed me how much information is collected beyond the content I actively post — including behaviour patterns, browsing activity, and inferred interests. Looking at my ad profiles was particularly surprising because some categories felt inaccurate or overly reductive. This highlighted how algorithms try to simplify complex identities into fixed labels.
The manual scraping exercise also revealed how subjective categorisation can be. Even when applying Sumpter’s method, I had to make constant decisions about how to classify posts, which made me aware of how algorithmic identity is shaped by arbitrary boundaries and human biases. Overall, this week helped me understand that algorithmic identities are fluid but also constrained, and that this process has social and political implications for visibility, targeting, and representation online.
Week 7:AI and Identities
Working with negative prompting this week unexpectedly made me rethink a formative memory from my own life. When I tried to guide the AI away from certain tones or interpretations, I realised how much I relied on the AI’s responses to clarify what I actually felt about the experience. Instead of simply generating a story, the process felt more like holding a mirror to myself — the AI’s probabilistic tendencies showed me interpretations I never intended, forcing me to refine what the experience meant to me.
Week 8:Digital Ecologies in Practice
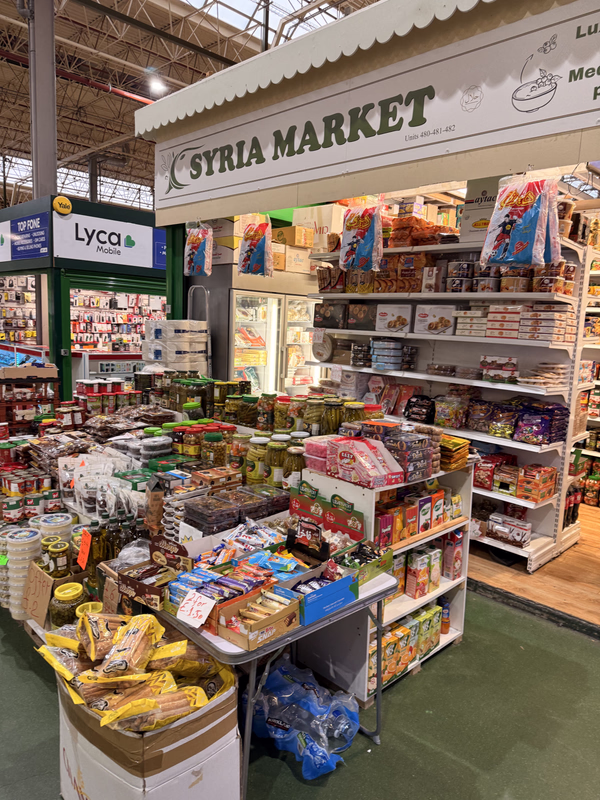
Visiting Kirkgate Market this week made me experience “digital ecology” in a much more embodied way than I expected. Using my senses — smell, sound, touch, and even the warmth of the crowded space — created an awareness that couldn’t be captured by digital tools alone. Recording small details on my phone made me realise how technologies mediate what I notice and what I overlook.
What stood out most was the idea of entanglement. The workshop helped me see how humans, foods, technologies, and global labour systems are deeply interconnected. Even my own hunger affected how I moved through the market — a reminder that sensing is never neutral.
Week 9:Creative Hacking, Senses and Bodies
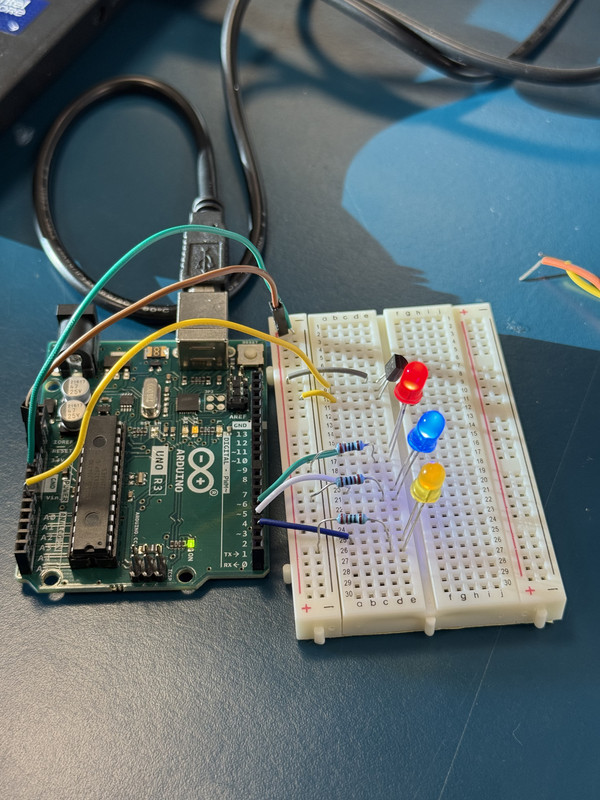
Week 9 was my first real encounter with creative hacking, and using Arduino to measure body temperature felt surprisingly intimate. Instead of thinking about data as abstract numbers, I suddenly became very aware that my body was the input. Watching the sensor translate temperature into numerical values and LED responses made me reflect on how digital systems reduce living, complex bodies into simplified signals. The unpredictability of the task — loose wires, unstable readings, things not working perfectly — actually helped me understand data as something situated and messy, not neutral or clean.
Week 10:Interactive Narrative
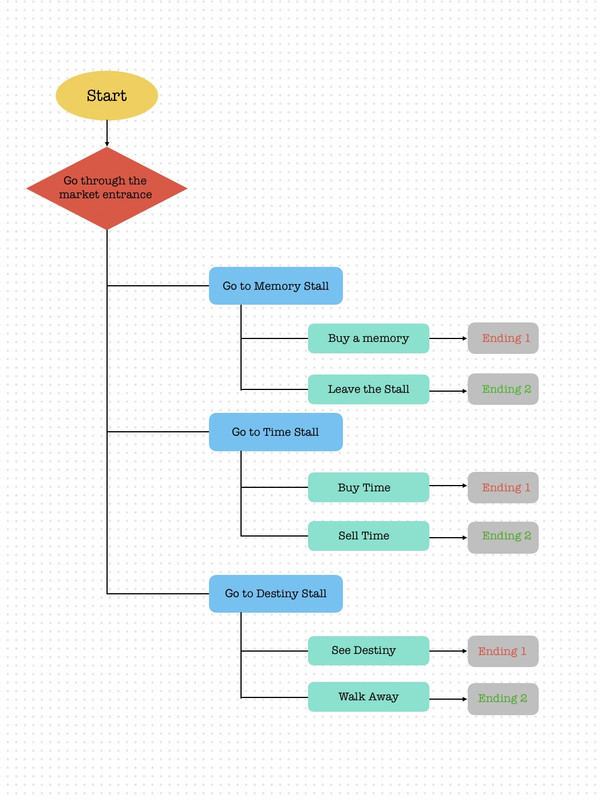
Creating an interactive narrative with Twine helped me understand Aarseth’s idea of ergodic literature in a hands-on way. Instead of writing a single, linear story, I had to think like both an author and a system designer. Mapping out the decision tree made me realise how much agency the “interactor” has — the reader becomes a co-author who shapes the story through their choices. This pushed me to think more carefully about how each link, passage, and branch communicates meaning beyond the text itself.
Play Midnight Market (Twine)Decision Tree: